Simple
Trading Systems
Stock Trading system No.1: 2005
Trading rules: 20% stop loss and 100% profit taken,based on a week-by-week price fluctuation:that's it, you don't have to watch every day the price of your stocks,but just at the end of the week!
Our performance data is based on those numbers. Please note that drawdowns of 25% are NOT unusual.
Before asking how we were able to achieve over 600% in one year, please make sure you understand the concept of compounding gains.
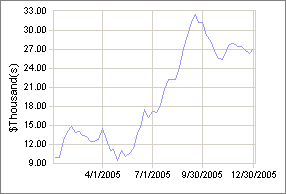
Performance data for No 1. (For our portfolio model performance, we've had this setup: $10k initial investment equally distributed between 5 stocks. We've reinvested all the proceedings from a sale of a stock of up to $10k/stock )
Here is the trading history for the year 2005:
| Company Name | Symbol | Open | Close | Entry Price | Final Price | Gain(loss) |
| A D C Telecom | ADCT | 01/03/05 | 03/17/05 | 18.76 | 14.56 | (-22.57%) |
| Entremed Inc | ENMD | 01/03/05 | 03/09/05 | 3.21 | 2.45 | (-23.85%) |
| Salton Inc | SFP | 08/22/05 | 10/27/05 | 2.53 | 1.94 | (-23.50%) |
| Homestore Inc | HOMS | 09/06/05 | 12/30/05 | 4.03 | 5.21 | 29.05% |
| Terayon Comm. | TERNE | 01/03/05 | 11/30/05 | 2.63 | 2.05 | (-22.23%) |
| Tweeter Hm Ent | TWTR | 10/27/05 | 12/30/05 | 5 | 5.62 | 12.19% |
| Intellisync | SYNC | 03/09/05 | 04/28/05 | 3.09 | 2.45 | (-20.89%) |
| Nuance Comm | NUAN | 04/28/05 | 12/30/05 | 4.23 | 7.65 | 75.84% |
| Wet Seal Inc | WTSLA | 03/17/05 | 06/30/05 | 3.4 | 6.88 | 102.09% |
| Cray Inc | CRAY | 11/30/05 | 12/30/05 | 1.5 | 1.35 | (-10.19%) |
| Distrib'd Engy | DESC | 01/03/05 | 07/19/05 | 2.5 | 5.62 | 124.48% |
| Paincare Hldgs | PRZ | 01/03/05 | 12/30/05 | 3 | 3.6 | 19.78% |
| Home SltnsOfAm | HOM | 07/19/05 | 09/06/05 | 1.65 | 3.93 | 137.84% |
| American Orient | AOB | 06/30/05 | 08/22/05 | 1.72 | 3.6 | 108.99% |
Performance data for: 2002 , 2003 , 2004, 2006
Any questions? We are here to answer them: [email protected]
Home| Members Only | Trading News | Subscribe | FAQ | Disclaimer | Privacy policy
Copyright 2005 MyTradingSystem.net
E-mail: Click
Here (remove NOSPAM)