Simple
Trading Systems
Trading system No1
| Year |
Cumulative gains(losses) |
SP500 performance |
|---|---|---|
1997 |
20% |
31.01% |
1998 |
97% |
26.67% |
1999 |
67% |
19.53% |
2000 |
426% |
-10.14% |
2001 |
37% |
-13.04% |
-9% |
-23.37% |
|
605% |
26.38% |
|
103% |
8.99% |
|
171% |
3.00% |
|
52% |
13.6% |
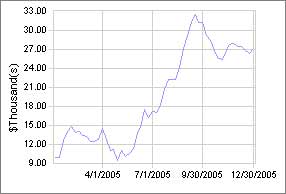
The portfolio performance for 2005:
Trading system No2
Year |
Cumulative gains(losses) |
SP500 performance |
2000 |
136% |
-10.14% |
2001 |
546% |
-13.04% |
580% |
-23.37% |
|
641% |
26.38% |
|
135% |
8.99% |
|
382% |
3.00% |
|
45% |
13.6% |
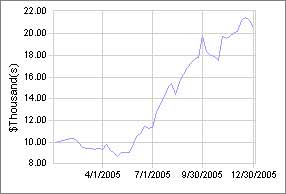
The portfolio performance for 2005:

Trading system No3
| Year |
Cumulative gains(losses) |
SP500 performance |
|---|---|---|
1997 |
21% |
31.01% |
1998 |
5% |
26.67% |
1999 |
123% |
19.53% |
2000 |
136% |
-10.14% |
2001 |
131% |
-13.04% |
39% |
-23.37% |
|
190% |
26.38% |
|
39% |
8.99% |
|
105% |
3.00% |
|
26% |
13.6% |
The portfolio performance for 2005:
The performance data for a particular year can be seen by clicking on the YEAR value from the tables above (2002 to 2006 only).
More information and the current holdings can be found in our "Members Only" area.
Home| Members Only | Trading News | Subscribe | FAQ | Disclaimer | Privacy policy
Copyright 2005 MyTradingSystem.net
E-mail: Click
Here (remove NOSPAM)