Simple
Trading Systems
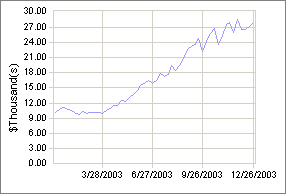
Stock Trading system No.3: 2003
Trading rules: Our performance data is based on: $10000 portfolio, with 50% margin, never invest more than $1000/stock.
There are NO stop losses or profit taken rules!
History of trades for year 2003:
| Company Name | Symbol | Open | Close | Entry Price | Final Price | Gain(loss) |
| Reliant Energy | RRI | 01/03/05 | 12/30/05 | 3.4 | 7.39 | 116.08% |
| Novell Inc | NOVL | 01/03/05 | 12/30/05 | 3.49 | 10.52 | 199.83% |
| Harris Intract | HPOL | 01/03/05 | 12/30/05 | 3.44 | 8.25 | 138.46% |
| A B B Ltd | ABB | 01/03/05 | 12/30/05 | 2.51 | 5.1 | 101.81% |
| T T M Tech Inc | TTMI | 01/03/05 | 12/30/05 | 3.48 | 17 | 386.15% |
| TradeStatn Grp | TRAD | 04/01/05 | 12/30/05 | 3.77 | 8.8 | 132.09% |
| Autobytel Inc | ABTL | 04/01/05 | 12/30/05 | 3.96 | 9.15 | 129.73% |
| Charming Shps | CHRS | 04/01/05 | 12/30/05 | 3.86 | 5.49 | 41.26% |
| Cable & WrlADR | CWP | 04/01/05 | 12/30/05 | 3.62 | 7.05 | 93.57% |
| ValueClick | VCLK | 04/01/05 | 12/30/05 | 3.18 | 9.12 | 185.24% |
| SiliconWare | SPIL | 07/01/05 | 12/30/05 | 3.5 | 5.35 | 51.84% |
| Anadigics Inc | ANAD | 07/01/05 | 12/30/05 | 3.36 | 6.14 | 81.61% |
| Gateway | GTW | 07/01/05 | 12/30/05 | 3.75 | 4.67 | 23.63% |
| QuickLogic Cor | QUIK | 07/01/05 | 12/30/05 | 3.3 | 4.96 | 49.30% |
| Microtune Inc | TUNE | 07/01/05 | 12/30/05 | 3.17 | 2.4 | (-24.99%) |
| Golden StarRsc | GSS | 10/03/05 | 12/30/05 | 4.07 | 6.97 | 70.17% |
| Corillian Corp | CORI | 10/03/05 | 12/30/05 | 3.8 | 6.12 | 60.01% |
| Coeur D Alene | CDE | 10/03/05 | 12/30/05 | 3.2 | 5.74 | 78.26% |
| Aquila Inc | ILA | 10/03/05 | 12/30/05 | 3.52 | 3.44 | (-3.07%) |
| Ariba Inc | ARBA | 10/03/05 | 12/30/05 | 19.74 | 18 | (-9.59%) |
Performance data for: 2002 , 2004 , 2005, 2006
If you would like the trading history for the years 1997 to 2001, please contact us.
Any questions? We are here to answer them: [email protected]
Home| Members Only | Trading News | Subscribe | FAQ | Disclaimer | Privacy policy
Copyright 2005 MyTradingSystem.net
E-mail: Click
Here (remove NOSPAM)