Simple
Trading Systems
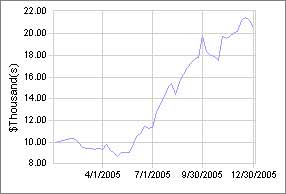
Stock Trading system No.3: 2005
Trading rules: Our performance data is based on: $10000 portfolio, with 50% margin, never invest more than $1000/stock.
There are NO stop losses or profit taken rules!
History of trades for year 2005:
| Company Name | Symbol | Open | Close | Entry Price | Final Price | Gain(loss) |
| Ciena Corp | CIEN | 01/03/05 | 12/30/05 | 3.35 | 2.97 | (-12.10%) |
| ViroPharma | VPHM | 01/03/05 | 12/30/05 | 3.13 | 18.5 | 488.29% |
| Grupo TMM ADR | TMM | 01/03/05 | 12/30/05 | 3.59 | 3.82 | 5.58% |
| Paincare Hldgs | PRZ | 01/03/05 | 12/30/05 | 3.00 | 3.6 | 19.12% |
| Entremed Inc | ENMD | 01/03/05 | 12/30/05 | 3.21 | 1.92 | (-40.83%) |
| Intellisync | SYNC | 04/01/05 | 12/30/05 | 3.65 | 5.15 | 40.13% |
| Net 1 Ueps Tech | UEPS | 04/01/05 | 12/30/05 | 18.33 | 28.73 | 55.70% |
| Abraxas Petro | ABP | 04/01/05 | 12/30/05 | 3.15 | 5.24 | 65.28% |
| Cenves Inc | CVO | 04/01/05 | 12/30/05 | 5.60 | 13.26 | 135.43% |
| Wet Seal Inc | WTSLA | 04/01/05 | 12/30/05 | 4.06 | 4.37 | 6.80% |
| S S T | SSTI | 07/01/05 | 12/30/05 | 4.12 | 5.05 | 21.66% |
| Yamana Gold | AUY | 07/01/05 | 12/30/05 | 3.69 | 6.81 | 83.38% |
| Columbia Labs | CBRX | 07/01/05 | 12/30/05 | 3.00 | 4.55 | 50.63% |
| Neose Tech | NTEC | 07/01/05 | 12/30/05 | 3.40 | 2.06 | (-40.07%) |
| ENGlobal Corp | ENG | 07/01/05 | 12/30/05 | 3.85 | 8.45 | 118.16% |
| American Orient | AOB | 10/03/05 | 12/30/05 | 4.86 | 4.37 | (-10.85%) |
| Birch Mtn Rescs | BMD | 10/03/05 | 12/30/05 | 5.00 | 7.3 | 45.02% |
| Bally TotFitns | BFT | 10/03/05 | 12/30/05 | 4.93 | 6.33 | 27.48% |
| Home SltnsOfAm | HOM | 10/03/05 | 12/30/05 | 5.10 | 4.48 | (-12.91%) |
| Homestore Inc | HOMS | 10/03/05 | 12/30/05 | 4.40 | 5.21 | 17.53% |
Performance data for: 2002 , 2003 , 2004
If you would like the trading history for the years 1997 to 2001, please contact us.
Any questions? We are here to answer them: [email protected]
Home| Members Only | Trading News | Subscribe | FAQ | Disclaimer | Privacy policy
Copyright 2005 MyTradingSystem.net
E-mail: Click
Here (remove NOSPAM)