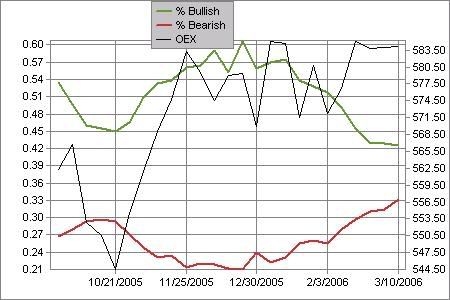
I don't like to get too hung up on one indicator, but the divergence between strong price action in the stock market and relatively negative sentiment from Investors Intelligence continues to intrigue me.
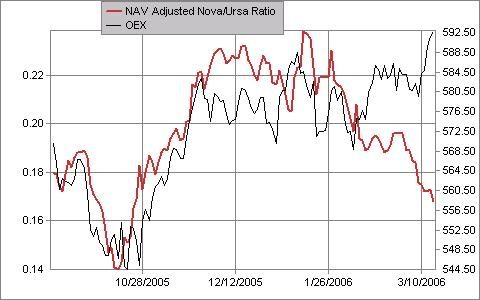
The Rydex Nova/Ursa ratio is also approaching a level more typical of bottoms than tops-
The bottom line is that there is considerable skepticism towards the market's ability to sustain its uptrend- which is bullish.
If you must worry about something, however, then you can note that as of the latest Commitments of Traders data, the Commercials are net short the S&P 500 by over 60,000 contracts, their largest net short position in over 2 years.
Market Revises Hypothesis
Fears of a 5.25% Fed funds rate by October and the prospect of either higher long term rates or a steeply inverted yield curve abated over the past week as the CPI was tame, and economic data was a bit softer than expected. February retail sales, initial jobless claims, consumer sentiment, the Philly Fed survey, and capacity utilization for February were all a bit weaker than the consensus forecasts. The yield on the 5 year T-note dropped from a high of 4.802% on Friday March 10 to close out this week at 4.621%.
Below is a chart of the Fed funds July 2006 futures contract from TFC charts. You can see the rally this week-
Whether this is just an oversold bounce or a more realistic appraisal of future Fed policy remains to be seen.