LLTC - 120105; 15-minute chart
at 2005-12-04 19:51:27
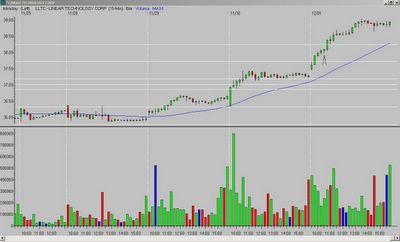
This trade is a little out of the "norm" as I usually take set-ups at support with a target around the Fibonacci extension. But LLTC was too good to pass up!
1.) What did I see?
A gap up and strong first five bars. Note how the third, fourth, and fifth bars narrow in range, and the fifth bar forms a nice hammer*.
2.) What is the entry?
A break of the fifth bar high.
3.) What is the exit?
The position was closed at the end of the day.
Notes - when you have a stock that pushes strongly through the Fibonacci extension, it has a good possibility of a continued rally. LLTC is a textbook example.
*most of you know,
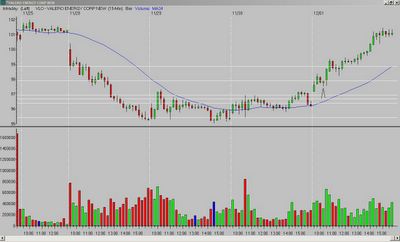
VLO - 120105; 15-minute chart
at 2005-12-04 19:51:27
1.) What did I see?
A gap up with the first three bars bouncing around the opening range high (set by the first 15-minute bar). What catches my eye is the fourth bar - after the previous bar closes below the OR high, the fourth bar forms a hammer* and closes (by .01!) back above that OR high - bullish signs all around.
2.) What is the entry?
A break of the fourth bar high.
3.) What is the exit?
1/2 closed after $1 gain. The other 1/2 was held until the end of the day. The notes on the LLTC chart are also applicable to VLO, so I included them below.
Notes - when you have a stock that pushes strongly through the Fibonacci extensio
More Festivus!
at 2005-12-04 19:51:27
A reader sent this to me - great laughs!
www.happyfestivus.com
Great day to end a great week - I will post some charts tonight.
LOGI - 120205; 15-minute chart
at 2005-12-04 19:51:27

Again, nice and simple makes money.
1.) What did I see?
A gap up and strong first bar. The second-fourth bars make a nice pullback from the morning high, without penetrating the 50% mark of the first bar (they also narrow in range). The fourth bar forms a nice hammer and starts the move back up.
2.) What is the entry?
A break of the fourth bar high.
3.) What is the exit?
The target was the Fibonacci extension of the previous day's low to the opening range high. LOGI took it's time reaching the target, but eventually got there before the close.
Notes - LOGI set-up nicely on the 30-minute chart, too.
MACR - 120205; 15-minute chart
at 2005-12-04 19:51:27

Nice and simple makes money.
1.) What did I see?
A gap up and strong first four bars (well - one, two, and four). Bars five through seven make an orderly pullback and stay above the opening range high (they also narrow in range). The seventh bar forms a nice hammer.
2.) What is the entry?
A break of the seventh bar high.
3.) What is the exit?
1/2 closed at the Fibonacci extension of the previous day's low to the opening range high. The other 1/2 closed after $1 gain.
|


